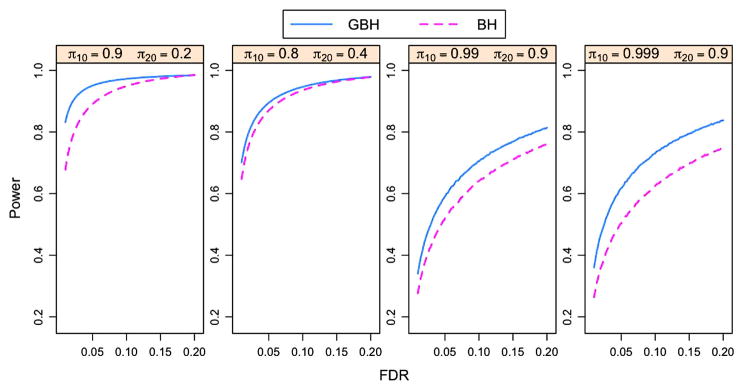
Figure 2.
Power curves of the oracle BH and GBH procedures for independent p-values. The p-values are generated based on model (4.1) with ξ1 = ξ2 = 0 and n = 10,000 for each group. Each panel corresponds to one combination of πg,0’s for two groups. The online version of this figure is in color.

