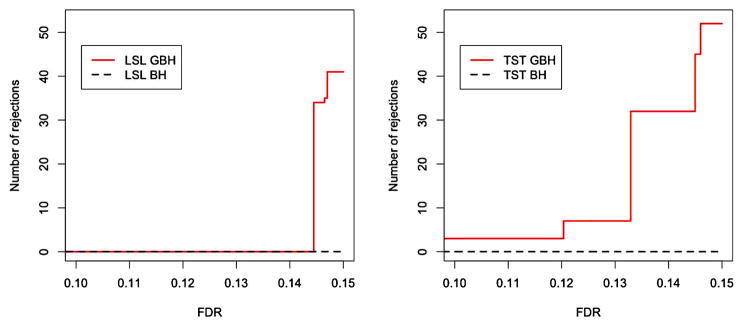
Figure 6.
Breast cancer study, 9492 genes. The plots show the number of genes detected by the adaptive BH and GBH procedures using Gene Ontology grouping. Left panel: the LSL method. Right panel: the TST method. Data from van’t Veer et al. (2002). The online version of this figure is in color.

