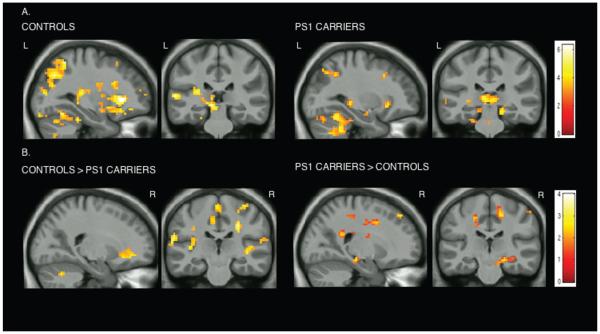
FIGURE 2.
Whole brain exploratory analyses. Statistical parametric maps (SPMs) for both groups, controls and PS1 mutation carriers, for the contrast novel face-name pairs vs repeated face-name pairs are displayed on anatomical images derived from an average obtained from the normalized structural images of all subjects with a statistical threshold of p < 0.005 uncorrected (extent threshold = 20 voxels). (A) Within-group analysis: both groups showed an increase in the fMRI signal response of association areas in the frontal and parietal lobes and in the hippocampal formation to novel vs repeated stimuli. (B) Between-group analysis: controls showed greater activity in frontal and parietal regions whereas carriers exhibited greater activity in the right cingulate gyrus and the right anterior hippocampus to novel vs repeated stimuli. Color bar represents t values for all activated voxels in the whole brain.

