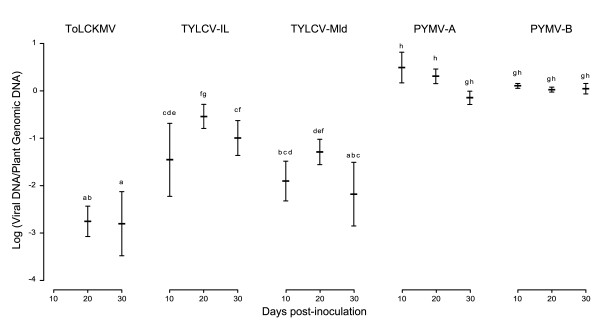
Figure 3.
Average virus accumulation of TYLCV-IL, TYLCV-Mld, ToLCKMV and PYMV (DNA-A and DNA-B) in tomato plants. Data were obtained from 8 plants inoculated per virus. Vertical bars around each point represent the 95% confidence interval and the bars topped by the same letter (a to h) are not significantly different at p = 0.01 (Tuckey's HSD test). None of the inoculated plants with the ToLCKMV-[YT:Dem:03] were detected as infected at 10 dpi.

