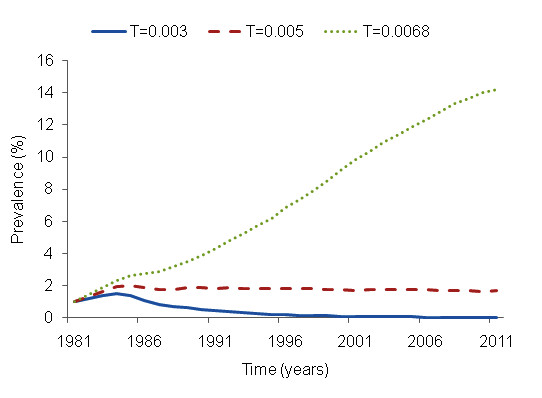
Figure 1.

HIV epidemic curves with constant probability of HIV transmission (no co-infection). At T = 0.003 no epidemic can be generated, and HIV prevalence decreases leading to extinction (prevalence estimated for 2010 = 0%)). With a T = 0.005 the infection can persist and reached and endemic steady state at a prevalence equal to the initial prevalence (HIV prevalence estimated for 2010 = 1%). At T = 0.0068 the epidemic curve generated is similar to the HIV epidemic observed in Malawi (HIV estimated prevalence for 2010 = 10%).
