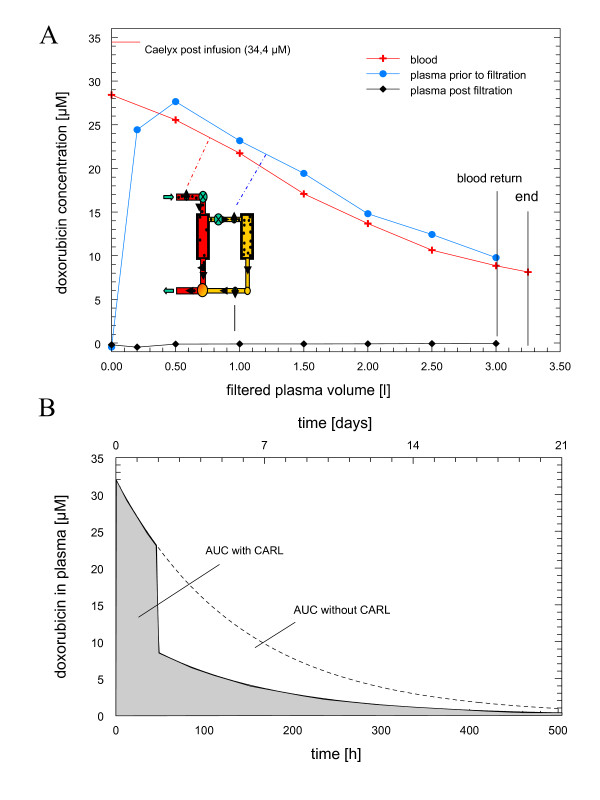
Figure 1.
Apheresis of liposomal doxorubicin. Chart A shows the concentration of doxorubicin during plasmapheresis in blood (red line), in the separated plasma prior to particle filtration (blue line) and post-particle filtration (black line). The insert shows a schema of the double filtration plasmapheresis used. Blood circuit is red and plasma circuit is yellow. First filtration separates plasma from blood cells, second filtration step eliminates particles. The plasmapheresis system returns the plasma and blood remaining in the extracorporeal unit to the patient once treatment is finished, and final blood concentration of doxorubicin was measured thereafter. Average blood flow rates were between 50 and 65 ml/min. A typical plasmapheresis is shown (n = 57). Chart B shows the estimated area under the plasma concentration curve (AUC) for liposomal doxorubicin without plasmapheresis (below dashed line) and with plasmapheresis (gray).

