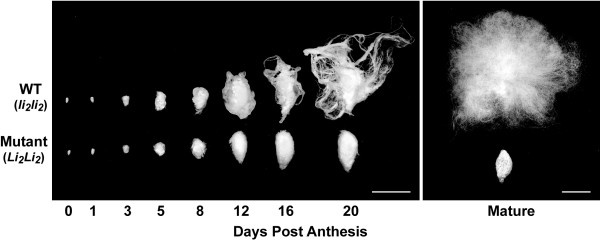
Figure 1.
Comparison of Li2 mutant and WT fibers and ovules during development. The differences in development of Li2 mutant and WT fibers and ovules are shown at selected time-points from DOA to 20 DPA (left panel), and at maturity following boll opening (right panel). The scale bars in both panels are 1 cm.

