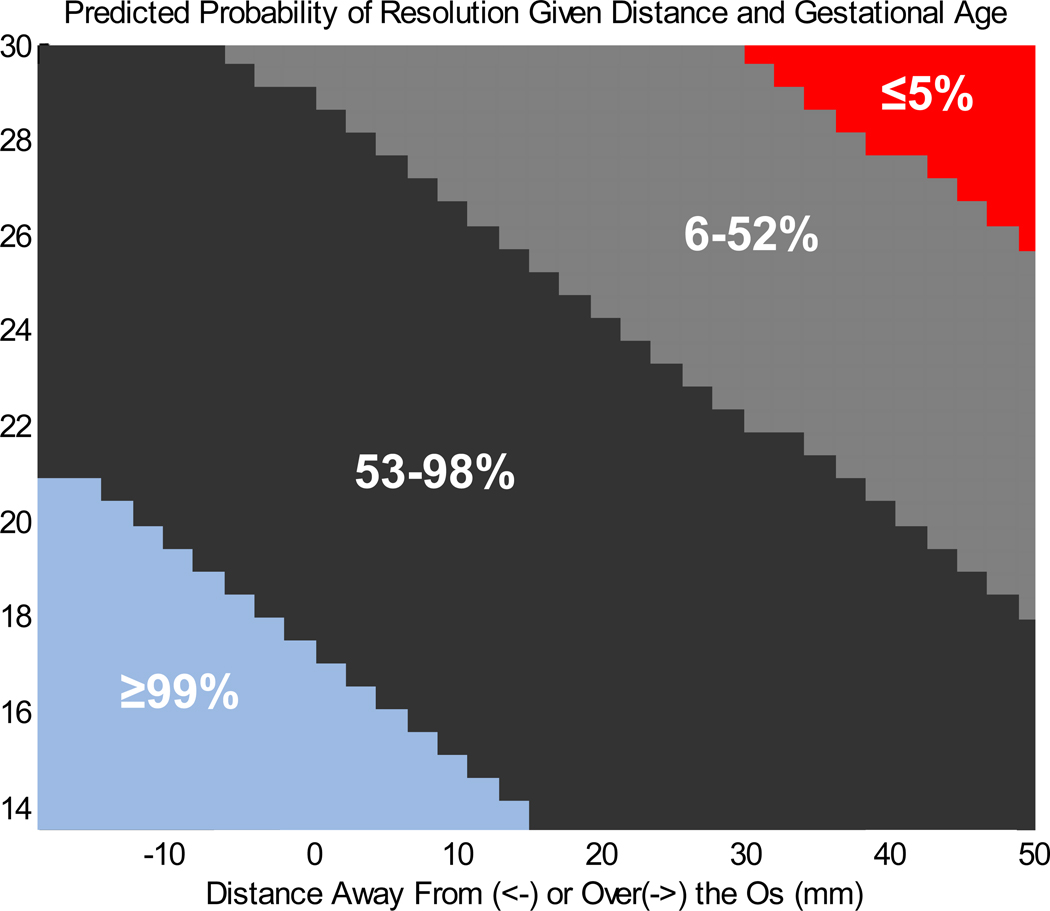
FIGURE 1. Likelihood of Resolution Modeling.
Predicted probability of resolution given distance from os and gestational age at diagnosis
X axis represents the distance away from or over the internal cervical os (point 0) in mm. Negative numbers represent distance away from the os, and positive numbers represent distance over the os.
Y axis represents gestational age in weeks at time of scan.

