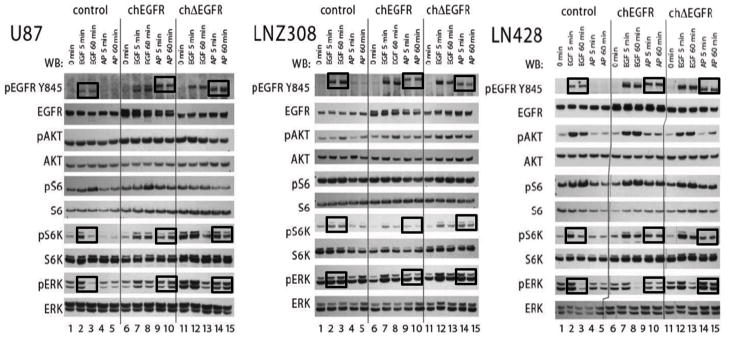
Figure 2.
Signaling by chEGFR and chΔEGFR Receptors. Glioma cells U87, LNZ308, and LN428 stably expressing control vector, chEGFR or chΔEGFR were serum starved and then stimulated with 20 ng/ml EGF or 50 nM AP20187 and analyzed at two time points, 5 and 60 min. EGFR downstream signaling was analyzed by immunoblotting with indicated pan- and phospho antibodies; pEGFR(Tyr 845), pAKT(Ser473), pS6K(Thr389), pS6(Ser235/236), and pERK1/2(Thr202/Tyr204).

