
Figure 2. Plaque load quantified with thioflavin fluorescence.
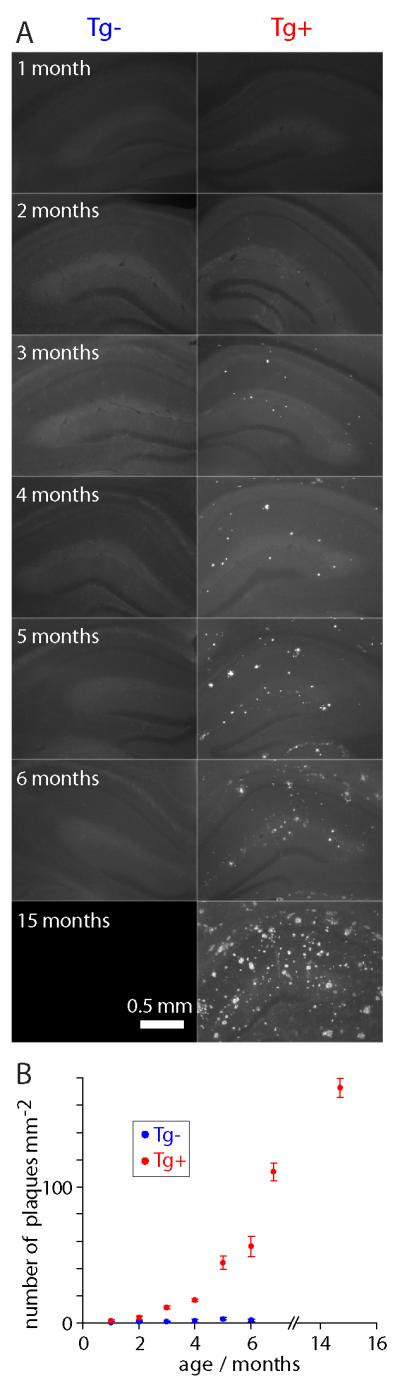
(A) Example widefield images of thioflavin staining showing hippocampi from Tg− and age-matched Tg+ CRND8 mice up to 15 months of age. 75 μm-thick fixed sections. (B) Plaque load as a function of age. Each data point is the mean (± SEM) of 4 sections from 2 mice.