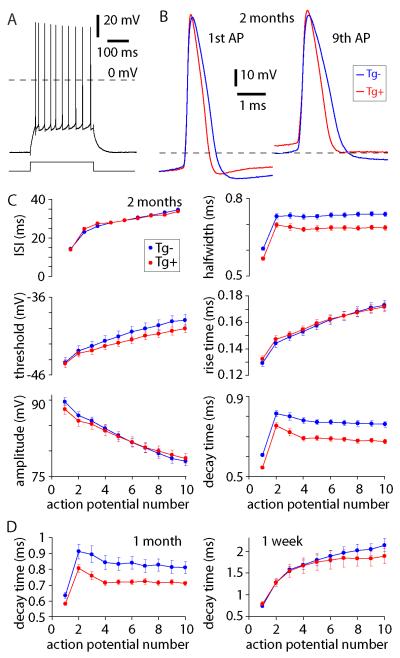
Figure 3. Altered action potential waveforms in CA1 pyramidal neurons from young Tg+ CRND8 mice.
(A) Example of a train of ten action potentials evoked by 300 ms current injection (200pA) from a CA1 pyramidal neuron, 2 month-old mouse. (B) Examples of action potentials from trains of ten APs, overlaid to allow comparison of AP waveforms of 2 month-old Tg+ (red) and Tg− (blue) mice. Dashed lines denote −40 mV. (C) Mean (± SEM) inter-spike interval, AP threshold, AP amplitude, AP half width, 10-90% rise time and 10-90% decay time during trains of 10 APs in 2 month-old Tg+ (red) and Tg− (blue) mice. n = 54 Tg− mice and 46 Tg+ mice. (D) 10-90% decay times of APs during trains in CA1 pyramidal neurons from 1 month- and 1 week-old mice. n = 14 Tg− and 16 Tg+ mice at 1 month of age; 9 Tg− and 10 Tg+ mice at 1 week of age.

