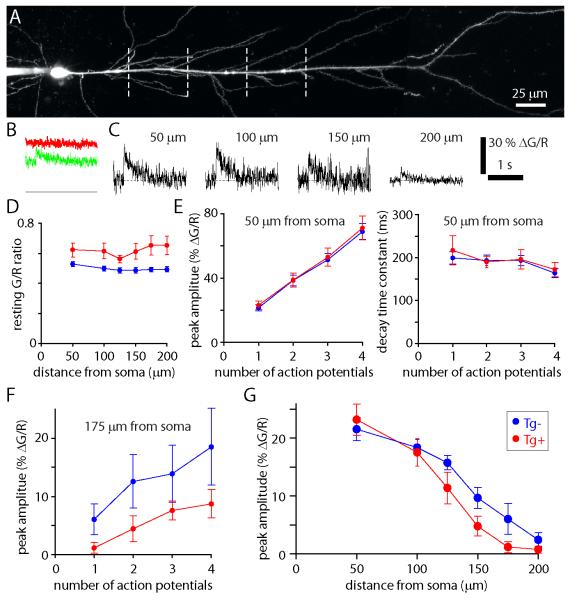
Figure 4. Altered calcium metabolism in the apical dendrites of 2 month-old Tg+ mice.
(A) Maximum intensity projection of the apical dendritic arbor of a CA1 pyramidal neuron filled with OGB-1 and Alexa 594. Dashed line: locations at which calcium transients were measured (50, 100, 150 and 200 μm from the soma). The soma and somatic recording pipette are on the left of the image. (B) Example calcium transients evoked by a single action potential in the neuron in A. The left-most panel shows raw OGB-1 (green) and Alexa 594 (red) signals from a single trial, measured 50 μm from the soma. Fluorescence is shown on an arbitrary fluorescence scale, with a zero fluorescence baseline. (C) Examples of AP-evoked fluorescence transients in the neuron in A. Transients were evoked by a single AP. Measurements 50, 100, 150 μm from the soma are single trials. The 200 μm measurement is the average of 13 trials. (D) Mean (± SEM) resting G/R ratios from Tg+ and Tg− mice, measured in the apical dendrite 50 to 200 μm from the soma. n = 9 Tg− (blue) and 7 Tg+ (red) neurons. (E) Peak amplitudes and decay time constants for calcium transients evoked by 1-4 APs, measured 50 μm from the soma. n = 9 Tg− and 7 Tg+ neurons. (F) Peak amplitudes of calcium transients evoked by 1-4 APs, measured 175 μm from the soma. n = 8 Tg− and 6 Tg+ neurons. (G) Peak amplitudes of calcium transients evoked by single APs as a function of distance from the soma. n = 9 Tg− and 7 Tg+ neurons.

