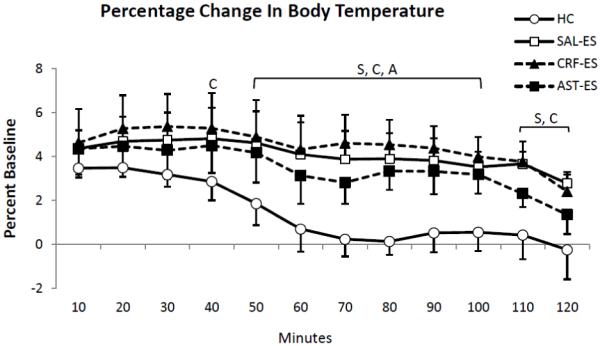
Figure 4.

Percent changes of core body temperature relative to baseline [(treatments - baseline)/baseline *100] presented in 10 min intervals for the first 2 h of recording for handling control (HC), ICV microinjections of saline prior to escapable shock (SAL-ES), corticotropin releasing factor prior to ES (CRF-ES) and astressin prior to ES (AST-ES). The letters S, C and A in the plot represent SAL-ES, CRF-ES and AST-ES, respectively, and indicate significant differences from HC, p < 0.05 or greater (Tukey tests). Values are means ± SEM.
