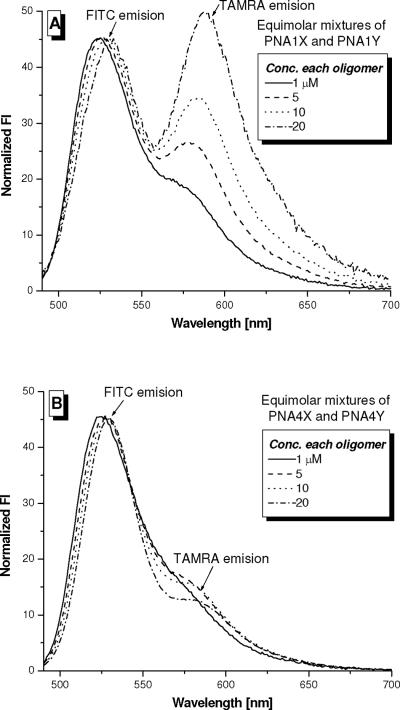
Figure 7.
Fluorescent spectra of (A) PNA1X/PNA1Y and (B) PNA4X/PNA4Y pairs at different concentrations. The samples were prepared by mixing equimolar ratios of the oligomers in 10 mM sodium phosphate buffer (pH 7.4). The samples were excited at 475 nm (FITC λmax) and the emissions were recorded from 480 to 700 nm. The spectra were normalized with respect to the FITC emission.

