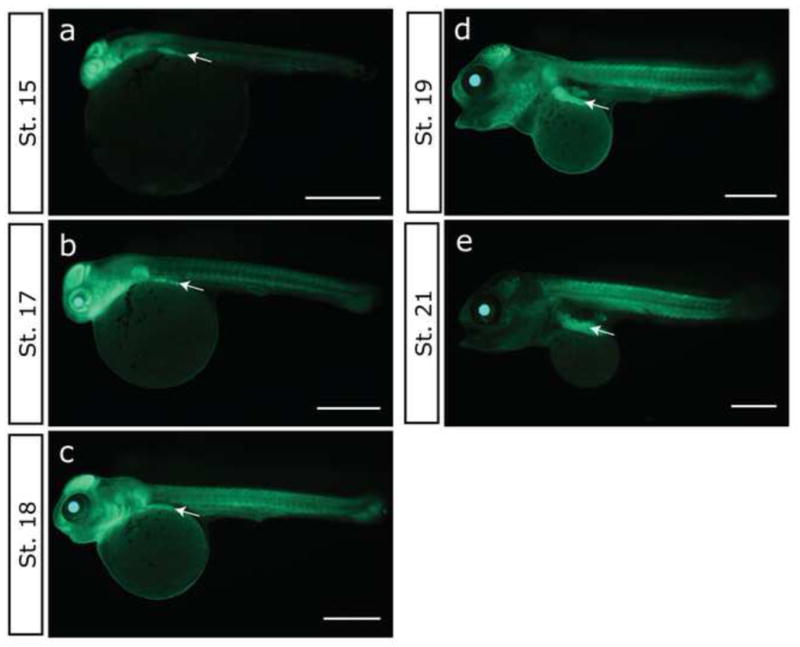
Fig.4.

GFP expression in the GFP ++ of G1 embryos during development from 4 to 8 days post-fertilization. Lateral views of embryos through GFP filter. (a) Stage 15 (4 dpf, 74 hpf). (b) Stage 17 (5 dpf, 100 hpf). (c) Stage 18 (6 dpf, 122 hpf). (d) Stage 19 (7 dpf, 143 hpf). (e) Stage 21 (8 dpf, 171hpf). Arrows indicate ‘undifferentiated white tissue’ (Fujimura and Okada 2007). Scale bar, 1 mm.
