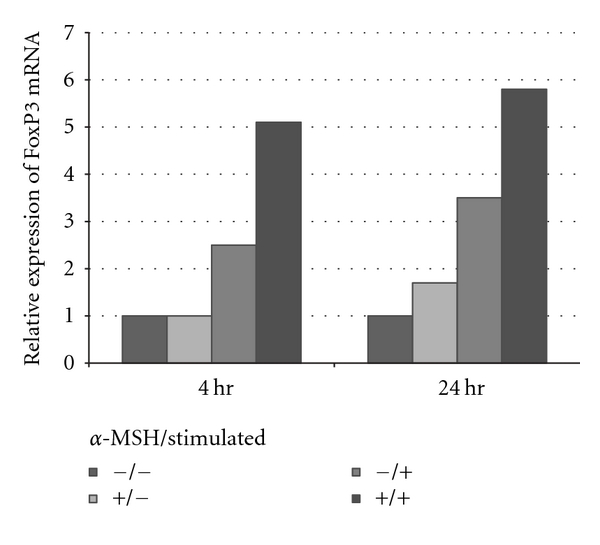
Figure 3.

Real-time PCR analysis of FoxP3 after α-MSH treatment. The CD4+ T cells were isolated from draining lymph nodes, stimulated and treated with α-MSH as before. At 4 hours and 24 hours after treatment, message was isolated and analyzed by RT-PCR. Presented results are representative of two independent experiments showing the relative levels of FoxP3 message in CD4+ T cells. There is consistently about a 2 fold-higher amount of FoxP3 message in the α-MSH-treated (+/+) than in the untreated effector T cells (−/+).
