
Figure 5.
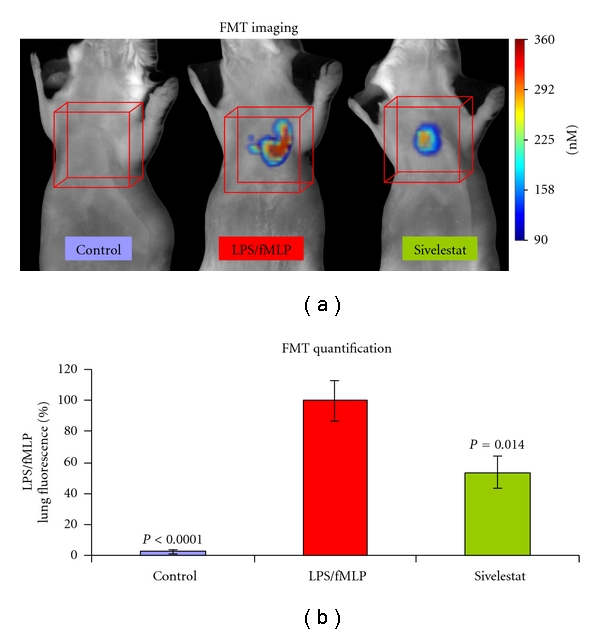
Imaging and quantification of NE680 activation in vivo. CD-1 mice were challenged i.n. with LPS and fMLP. A subset of mice was also treated with the NE inhibitor sivelestat 15 min prior to fMLP and NE680 (4 nmoles i.n.) and mice imaged 5 h later by FMT 2500. (a) Representative volume rendering projections taken at the same color gating from control, LPS/fMLP and LPS/fMLP mice which had been treated with sivelestat (5 mg/kg i.n.). (b) The mean concentration of fluorescence (in nM) was quantified in specific ROIs for the lung area in control mice (N = 12), mice with ALI (N = 16), and Mice with ALI treated with sivelestat (N = 12) at a dose of 5 mg/kg i.n.