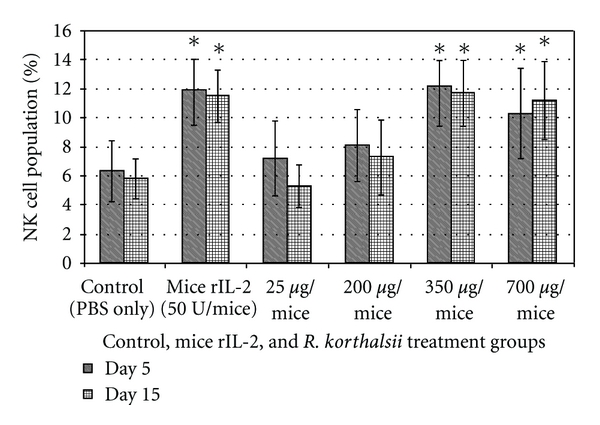
Figure 2.

NK cell immunophenotyping on mice blood after being treated with various concentration of R. korthalsii methanol extract or mice rIL-2 for day 6 and day 16 in vivo. Each value represents the means ± SEM for three assays in duplicate each. The differences between the control group and treated group were determined by one-way ANOVA (*P ≤ 0.05).
