
Figure 3. Population doubling times - Renal cortical cells on renal ECM.
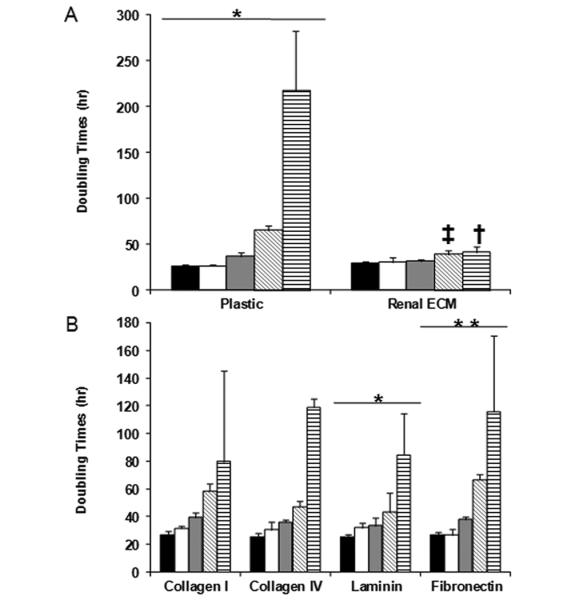
(A-B) (black - P1, white - P2, gray - P3, diagonal hatched - P4, vertical hatched - P5) The Y-axis represents population doubling times (h). The population doubling times suggest that in the early passages, the substrate did not alter the growth capabilities of the cells. For passages 4 and 5, renal ECM was shown to support the optimal population doubling times. Comparisons were made of passage 1 (P1) versus passage 5 (P5) for each substrate; *p<0.05, **p<0.01. Comparisons of renal ECM with plastic are shown at passage 4 (‡p<0.01), and renal ECM with plastic, fibronectin, and laminin at passage 5 (†p<0.05).