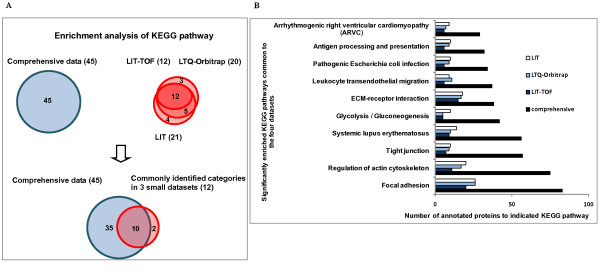
Figure 7.
Comparison of enrichment analysis results of KEGG pathway among the three small datasets and the comprehensive database. A. The graph represents the number of annotated pathways of each dataset which were found to be significantly enriched (p < 0.05) in the glomerulus. The overlapping among the four datasets is also shown. B. Data are presented as a bar chart of 10 over-represented pathways which were commonly identified in the four datasets.

