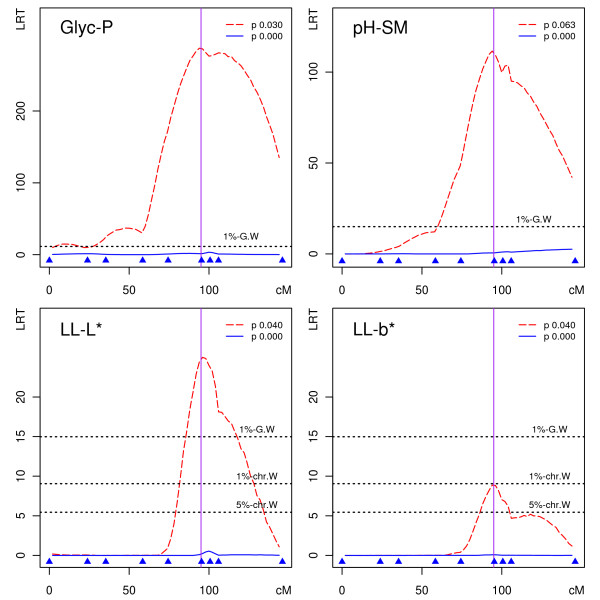
Figure 2.
Detection of the PRKAG3 Gln200 mutation as a QTL on SSC15. LRT profiles for QTL detection on SSC15 within a population including (red dashed line) or excluding (blue continuous line) the PRKAG3 Gln200 allele for four different traits (p as Gln200 allele frequency). A vertical line is drawn at the PRKGA3 position on the SSC15 genetic map. The genetic markers used are represented by filled blue triangles above the x-axis (cM).

