
Figure 2.
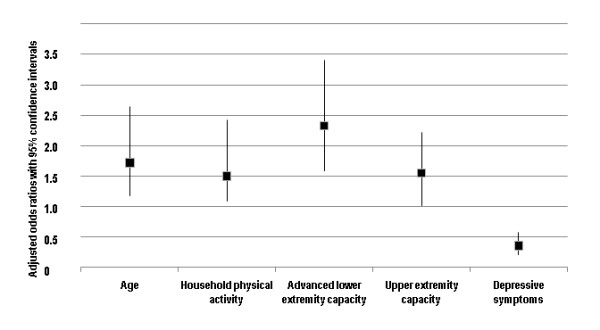
The likelihood (adjusted odds ratios) of better self-rated health per one standard deviation unit of each explanatory variable in the minimal multivariate model.
Official websites use .gov
A
.gov website belongs to an official
government organization in the United States.
Secure .gov websites use HTTPS
A lock (
) or https:// means you've safely
connected to the .gov website. Share sensitive
information only on official, secure websites.
The likelihood (adjusted odds ratios) of better self-rated health per one standard deviation unit of each explanatory variable in the minimal multivariate model.