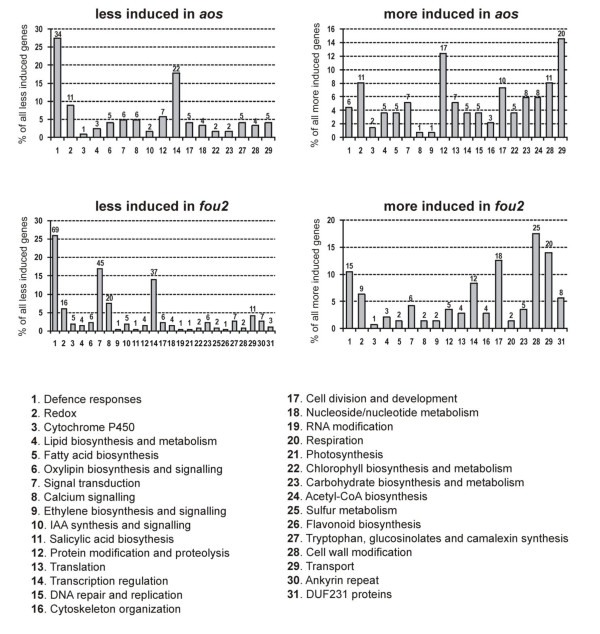
Figure 3.
General overview of differences in responsiveness of aos and fou2 mutants to B. brassicae attack compared to responsiveness in wt. Bars represent contribution of different functional categories in the pool of all genes that were either less or more induced upon infestation with aphids in aos or fou2 genotype in comparison to wt. Numbers placed on the top of each bar indicate how many genes were differentially regulated in response to B. brassicae attack in each functional category in a given mutant as compared to wt.

