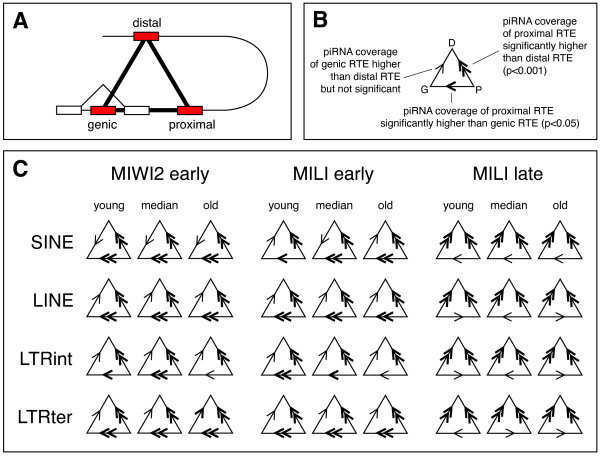
Figure 5.
piRNA coverage and genomic context. A) Schematic depiction of the 3 categories of RTE loci (shown as red boxes). Genic RTEs reside inside the boundaries of protein-coding genes (exons shown as white boxes), proximal RTEs reside close to genes, and distal RTEs reside far from genes. The three RTE boxes are connected by a triangle, and in the remainder of the figure this triangle will symbolise the three categories of RTE loci. B) Example of the triangle graphic. The corners of the triangle correspond to the three categories of RTE loci (highlighted by their first letter in this example), and larger-than and smaller-than signs denote the relative levels of piRNA coverage of the categories. One thin sign corresponds to a non-significant difference, one bold sign to a significant difference at the 0.05 level, and two bold signs to a significant difference at the 0.001 level (see Methods section). C) Symbolic presentations of the real differences in piRNA coverage levels. RTEs are grouped into the 4 shown types (left), and differences are shown for the 3 libraries (top), with RTE loci divided according to age (for each family independently, see main text for details). Absolute values and significance levels are available in Additional File 1, Table S4.

