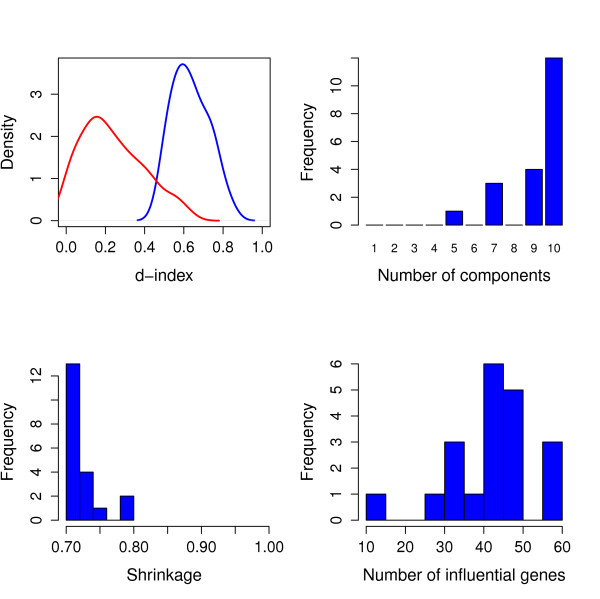
Figure 1.
Over all distribution of model parameters and performance. Results obtained from the 20 ST-PLS model fits. The upper left panel shows the distribution of the d-index, which is a measure for a models explanatory power (range 0-1) obtained from the cross validation by using the finally selected shrinkage level and a number of components. The blue curve indicate its distribution for our 20 phenotypes, and the red curve is the distribution of this measure if the X matrix is replaced by a random shuffling of its rows, i.e. a 'null'-distribution. The upper right panel shows the distribution of the number of components selected (range 1-10), the lower left panel similar for shrinkage level (range 0.7-0.96) and the lower right panel similar for the number of associated genes.

