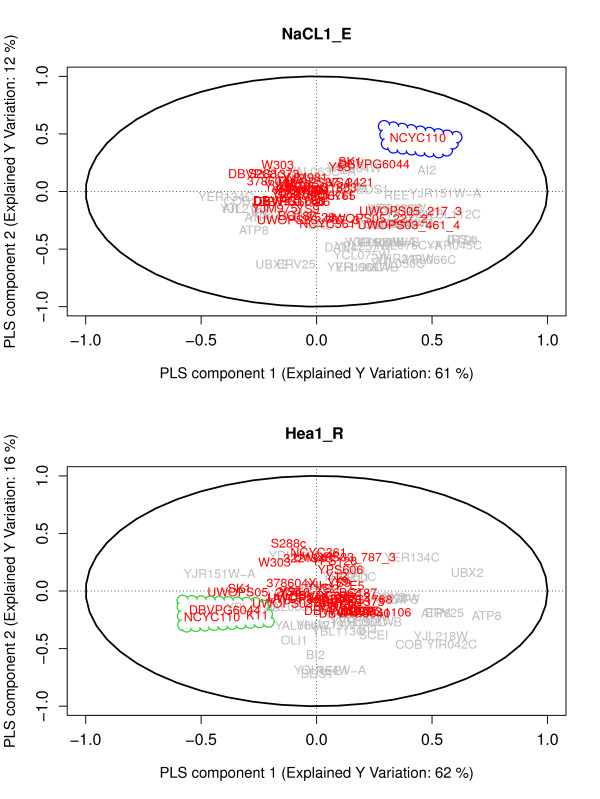
Figure 4.
Biplots for NaCL1_E and Hea1_R. The biplot for NaCL1_E (NaCl 0.85 M Efficiency) in upper panel and for Hea1 R (Heat 37°C Rate) in lower panel is presented. Genes are labeled by their names in gray color and strains are indicated by red color. For the model NaCL1_E most variant strain NCYC110 is identified and is marked by the blue cloud. For Hea1_R two most variant strains NCYC110 and DBVPG6044 are identified with their related genes in a green cloud.

