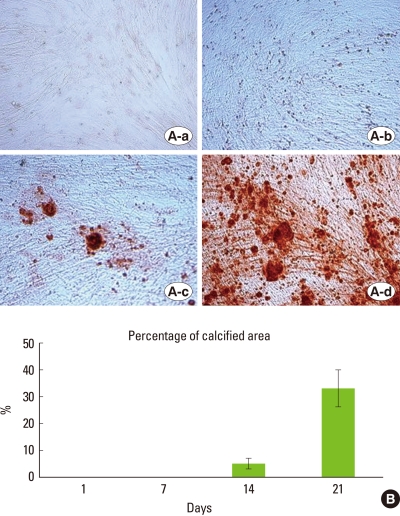
Figure 1.
Morphology of the various stages and percentage of calcified areas during the formation of mineralized nodule by human periodontal ligament (PDL) cells. (A) shows the visual field at ×200 magnification on days 1(a), 7(b), 14(c), and 21(d). Developed mineralization is observed and size and number of nodules are increased compared to PDL cells on day 14. (B) Measurement of calcified areas by Alizarin Red S stain. Data are shown as the mean±SD of two patients. Percentages of the calcified areas are 5% and 33% of the culture dish on day 14 and 21, respectively.

