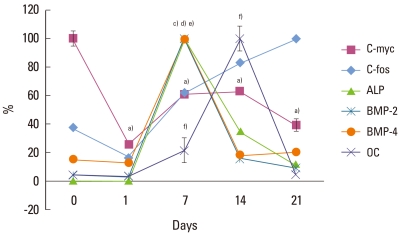
Figure 3.
Gene expression pattern during mineralization of periodontal ligament cells. Expression of genes was analyzed by real-time PCR and normalized to the levels of GAPDH mRNA. Values are presented as the percent of the maximal expression for each transcript. a)c-myc, b)c-fos, c)ALP, d)BMP-2, e)BMP-4, f)OC. a),c)-f)Statistically significant difference as compared with day 0 (P<0.05). b)(P>0/05).

