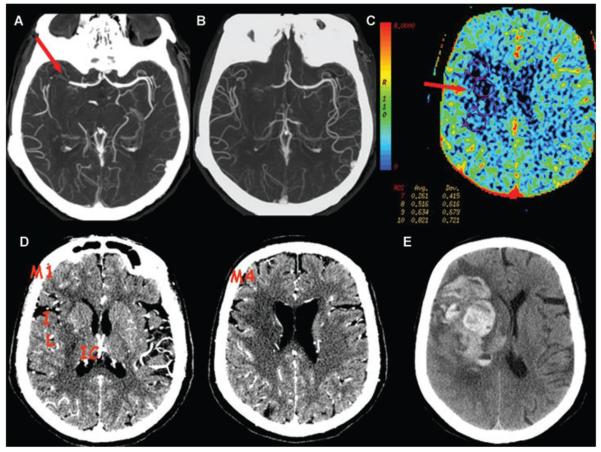
Fig 2.
A 62-year-old female presented at 5 hours and 20 minutes from onset of left hemiparesis. NIHSS score was 16. (A) CTA thin MIP shows clot at the distal M1 segment extending into the M2 branches of the right MCA. (B) CTA thick MIP shows collateral supply that fills >50% but < 100% of the vessels compared to the contralateral left MCA branches, for a collateral score of 2. (C) CBV map shows hypoperfusion to the proximal right MCA territory with a minimal CBV sampling of .26 mL/100 g (ROI no.7). (D) CTA-SI shows hypoattenuation in the lentiform nucleus (L), internal capsule (IC), insula (I), M1, and M4, for ASPECTS of 5. No treatment was attempted. (E) Follow-up NCCT at 46 hours was obtained for acute mental status change and shows a type 2 parenchymal hematoma.

