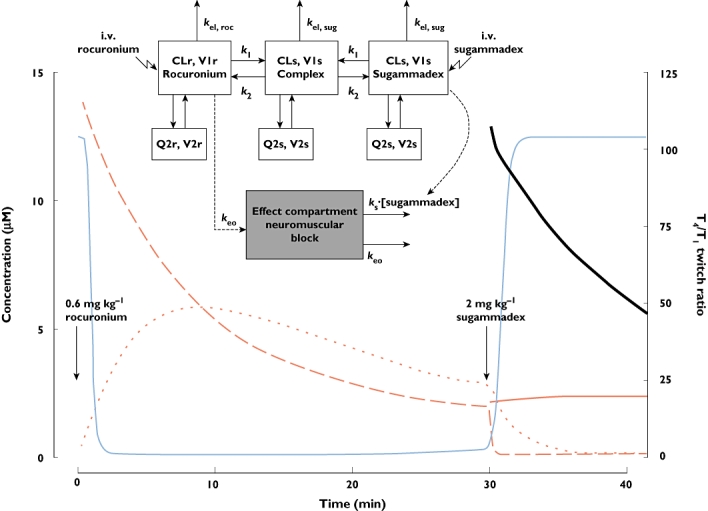
Figure 1.

The final pharmacokinetic–pharmacodynamic interaction model and illustration of pharmacokinetic and pharmacodynamic response profiles. Abbreviations: CLr, rocuronium clearance; CLs, sugammadex clearance; k1, rate constant of association between sugammadex and rocuronium; k2, rate constant of dissociation; kel,roc, rate of elimination of rocuronium; kel,sug, rate of elimination of sugammadex; keo, distribution rate constant between central and effect compartments; ks, rate constant; Q2r, intercompartment clearance of rocuronium from the central to the peripheral compartment; Q2s, intercompartment clearance of sugammadex from the central to the peripheral compartment; V1r, volume of distribution of rocuronium in the central compartment; V1s, volume of distribution of sugammadex in the central compartment; V2r, volume of distribution of rocuronium in the effect compartment; and V2s, volume of distribution of sugammadex in the effect compartment. Rocuronium plasma, free ( ); Rocuronium plasma, free + complex (
 ); Rocuronium effect compartment, free (
 ); sugammadex plasma, free + complex (
 ); T4/T1 twitch ratio (
 )
)
