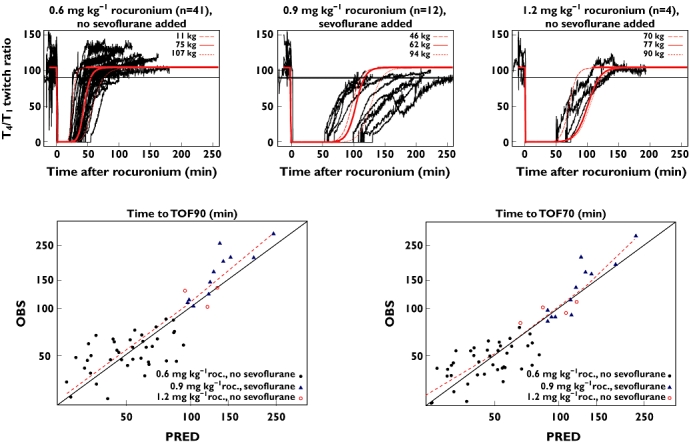
Figure 5.

Upper graphs show the observed T4/T1 twitch ratio upon spontaneous neuromuscular blockade reversal following rocuronium administration, conditioned on administered dose and use of sevoflurane anaesthesia (n = 59). Lower graphs show the posterior predictive check of the pharmacokinetic–pharmacodynamic model for spontaneous reversal [time to train-of-four ratios of 0.7 and 0.9 (TOF70 and TOF90)] of rocuronium-induced neuromuscular blockade, observed (OBS) vs. predicted (PRED) reversal times. Red lines represent population predictions for three typical subjects reflecting variability in bodyweight. Demographic data from patients with lowest, median and highest bodyweight, within the depicted populations were used to define these typical subjects; two patients receiving maintenance rocuronium doses are not shown. Red dashed lines in lower graphs represent loess smooth curve. Prediction error (OBS–PRED) for population-predicted TOF90 was as follows: 1.5 min for 0.6 mg kg−1 rocuronium with no sevoflurane; 23.25 min for 0.9 mg kg−1 rocuronium with sevoflurane; and 1.25 min for 1.2 mg kg−1 rocuronium with no sevoflurane. Prediction error (OBS–PRED) for population-predicted TOF70 was as follows: 0.88 min for 0.6 mg kg−1 rocuronium with no sevoflurane; 6.75 min for 0.9 mg kg−1 rocuronium with sevoflurane; and1.63 min for 1.2 mg kg−1 rocuronium with no sevoflurane
