
Figure 1.
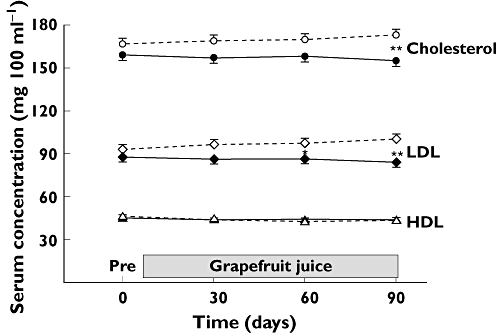
Mean (± SE) values of total cholesterol, low-density lipoproteins (LDL), and high-density lipoproteins (HDL) at corresponding sampling times for patients in arm A and arm B. Asterisks show the outcome of non parametric statistical testing comparing the change over the day 0 baseline values for arm A vs. arm B at corresponding times (* indicates P < 0.05; ** indicates P < 0.002). Arm A ( ); Arm B (
 )
)