
Figure 2.
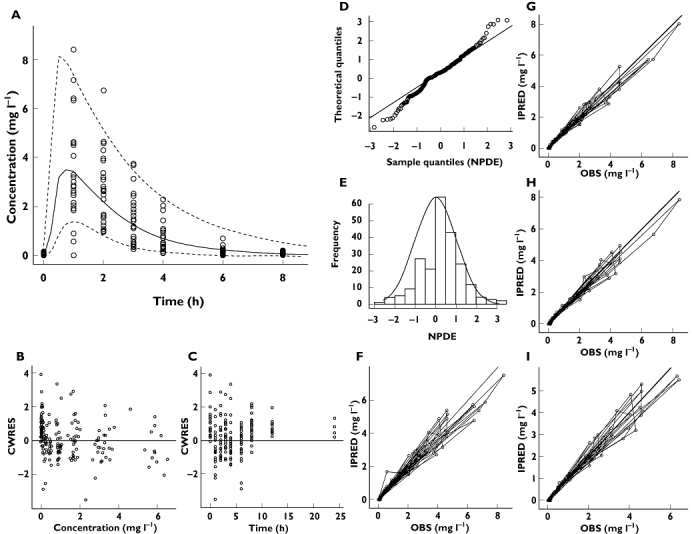
Diagnostic plots of the model based on data from children (Model 1). (A) VPC, (B) conditional weighted residuals vs. predicted concentrations, (C) conditional weighted residuals vs. time, (D, E) NPDE, (F) post hoc predictions vs. observed concentrations, (G, H, I) mirror plots. All diagnostic measures indicate acceptable goodness-of-fit and model performance, except for a slight skewness in the NPDE distribution and overestimation of variance after 4 h (panel A)