
Figure 5.
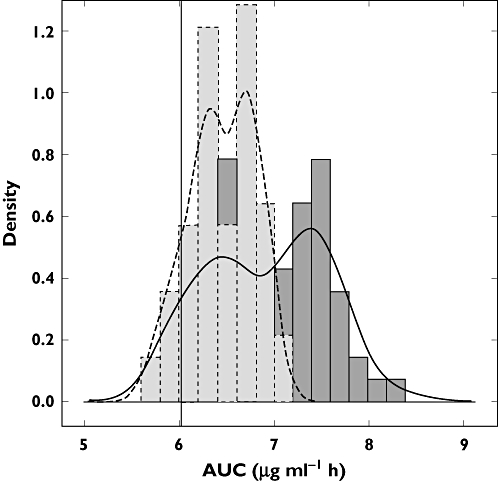
Exposure distribution in children (2–13 years old) as estimated by Model 1 (dark grey, solid line), and as predicted by Model 2 (light grey, dashed line). The black vertical line represents the target exposure (6.02 µg ml−1 h)
Official websites use .gov
A
.gov website belongs to an official
government organization in the United States.
Secure .gov websites use HTTPS
A lock (
) or https:// means you've safely
connected to the .gov website. Share sensitive
information only on official, secure websites.
Exposure distribution in children (2–13 years old) as estimated by Model 1 (dark grey, solid line), and as predicted by Model 2 (light grey, dashed line). The black vertical line represents the target exposure (6.02 µg ml−1 h)