
Figure 9.
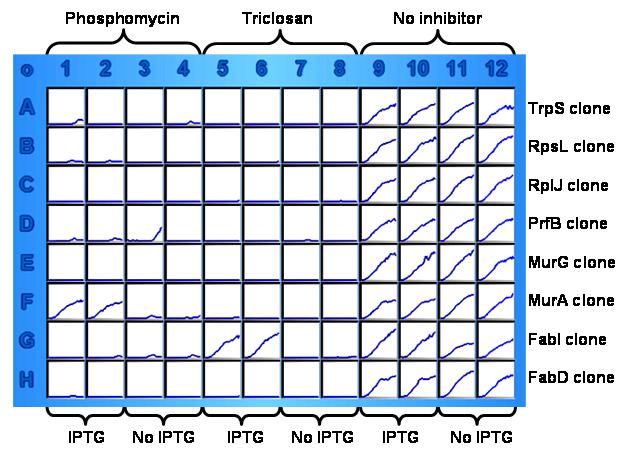
A kinetic growth image of a microplate-based target identification assay. The wells of each row contained one individual clone (marked on the right). Columns 1 to 4 contained 2 μg/ml of phosphomycin. Columns 5 to 8 contained 8 μg/ml of triclosan. Columns 9 to 12 contained no inhibitor to serve as cell growth control. For each inhibitor treatment, half of the wells also contained 1 mM IPTG while the other half did not (shown at the bottom).