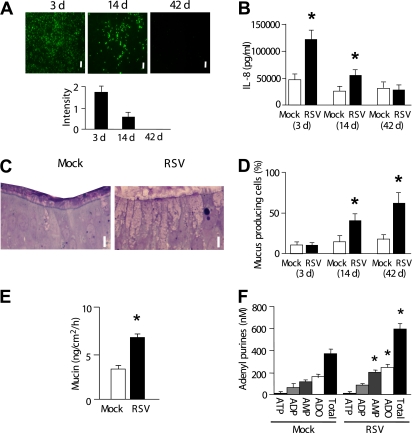
Figure 1.
Time course of respiratory syncytial virus (RSV) infection, RSV-induced goblet cell metaplasia, and extracellular adenyl purine profiles. The data were obtained at 3, 14, and 42 days after RSV (or mock) infection. (A) Top: Live intracellular RSV intensity visualized by green fluorescent protein fluorescence of the recombinant virus (rgRSV). Bar, 30 μm. Bottom: Quantitation of green fluorescent protein fluorescence intensity (by Image J). (B) IL-8 levels in serosal medium. (C) Representative x-z sectioned histological pictures (Richardson staining) of primary human bronchial epithelial cultures at 14 days after mock (left) or RSV (right) infection. Bar, 10 μm. (D) Percentages of mucus-producing cells (goblet cells) quantitated in laser confocal microscopy images of differential immunostaining for ciliated cells (red; tubulin) and goblet cells (green; periodic acid-Schiff) overlayed with differential interference contrast images. (E) Mucin secretion rates in control and RSV-induced goblet-cell metaplastic cultures as measured by ELISA over 12 hours. Mucosal surfaces were washed, and cultures were rested for 24 hours. At t = 0, 3, 6, 9, and 12 hours, 75 μl Dulbecco's modified Eagle's medium was added on cultures mucosally. Cultures were incubated for 10 minutes at 37°C and sampled for ELISA. Mucin secretion rates over 12 hours were calculated from the amount of mucins in samples at each time point. (F) Concentrations of adenyl purines in airway surface liquid sampled from resting cultures at 42 days after mock (left blocks) or RSV (right blocks) infection, as analyzed by etheno-derivatization. *Significant difference (P < 0.05) over mock-infected control cultures. Values are mean ± SE of four Transwells/subject established from three different subjects.

