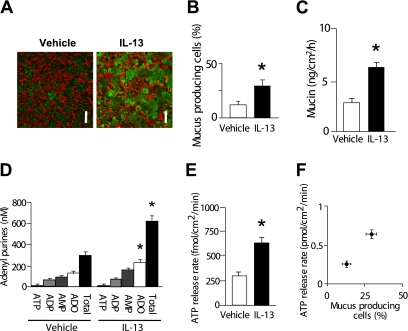
Figure 3.
Goblet cell metaplasia after IL-13 treatment. (A) Representative images of differential immunohistochemistry for ciliated cells (red; tubulin) and goblet cells (green; periodic acid-Schiff) after 5 days of treatment with vehicle (left) or IL-13 (right). Bar, 30 μm. (B) Goblet cell percentages in vehicle- or IL-13–treated cultures quantitated from the confocal images as represented in A. (C) Mucin secretion rates in control and IL-13–treated goblet-cell metaplastic cultures as measured by ELISA over 12 hours. (D) Concentrations of adenyl purines in airway surface liquid sampled from vehicle- or IL-13–treated cultures under resting condition, as measured by etheno-derivatization. (E) ATP release rates in vehicle- or IL-13–treated cultures. (F) Correlation between goblet cell percentages (data imported from B) and ATP release rates (data imported from E). *Significant difference (P < 0.05) over vehicle-treated control cultures. Values are mean ± SE of three Transwells/subject established from three different subjects.

