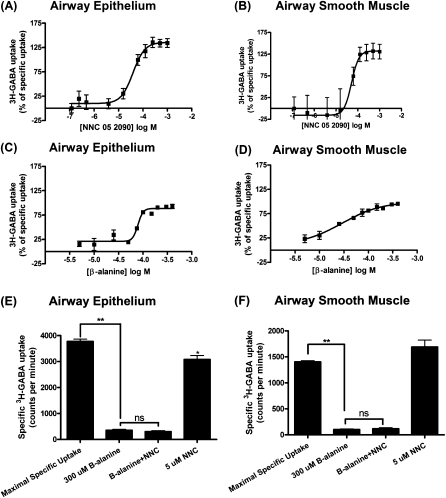
Figure 5.
3H-GABA uptake and release assays. (A–D) Dose–response curves using GAT isoform inhibitors in human airway epithelial and smooth muscle cells. Human airway epithelial cell dose–response curves with (A) NNC 05-2090, a selective GAT4/BGT-1 inhibitor (half maximal [50%] inhibitory concentration or IC50, 39 μM) and (C) β-alanine, a selective GAT2 inhibitor (IC50, 79 μM). Human ASM cell dose–response curves with (B) NNC 05-2090, a selective GAT4/BGT-1 inhibitor (IC50, 51 μM) and (D) β-alanine, a selective GAT2 inhibitor (IC50, 28 μM). Dose–response curves are representative of four experiments. Data are presented as means (±SEM). (E) Effect of GAT2 and GAT4 inhibitors alone or in combination on 3H-GABA uptake in human bronchial epithelial cells. The GAT2 inhibitor, β-alanine, significantly decreases specific 3H-GABA uptake (n = 6; **P < 0.001), and the addition of the GAT4 inhibitor, NNC 05-2090, does not further decrease specific 3H-GABA uptake. Addition of 5 μM NNC 05-2090 alone induced a small but significant decrease in specific 3H-GABA uptake (n = 6; *P < 0.05). (F) Effect of GAT2 and GAT4 inhibitors alone or in combination on 3H-GABA uptake in human ASM cells. The GAT2 inhibitor, β-alanine, significantly decreases specific 3H-GABA uptake (n = 12; **P < 0.001), and the addition of the GAT4 inhibitor, NNC 05-2090, does not further decrease specific 3H-GABA uptake. Data are presented as means (±SEM).

