Figure 3.
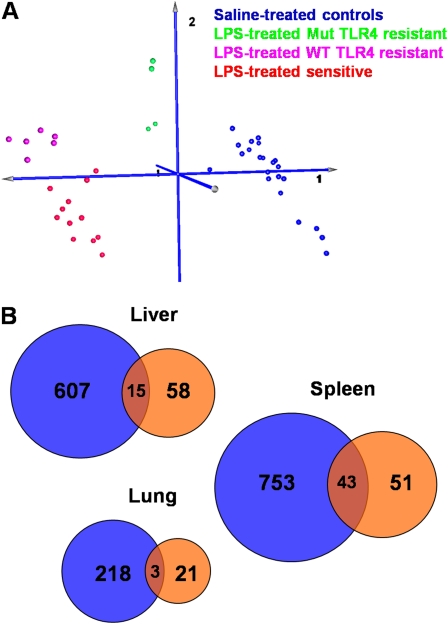
Gene expression analysis of lung, liver, and spleen tissue in response to systemic LPS. (A) Principal component analysis of liver samples using interaction-term significant genes (P < 0.01) from the two-factor ANOVA analysis of sensitive compared with all resistant mouse strains (regardless of TLR4 genotype) in response to systemic LPS challenge. Samples are separated into four well defined clusters: a cluster containing saline-treated controls (blue), a cluster of LPS-treated resistant strains that lack functional TLR4 (Mut TLR4, green), a cluster of LPS-treated resistant strains with functional TLR4 (wild-type [WT] TLR4, magenta), and a cluster containing sensitive strains treated with LPS (red). Resistant strains lacking functional TLR4 are closer to unexposed controls, whereas resistant strains with functional TLR4 are closer to but still distinct from sensitive strains, suggesting that different sets of transcripts differentiate the two subgroups of resistant strains from sensitive ones. (B) Venn diagrams showing the number of transcripts that are differentially expressed in response to LPS challenge in sensitive compared with Mut TLR4–resistant (blue circles) or in sensitive compared with WT TLR4–resistant (orange circles) strains in the liver, lung, and spleen tissue. Differentially expressed genes were identified as those having P < 0.01 in the two-factor ANOVA interaction term and 1.5-fold differential expression. Fold change was calculated as the ratio of (exposed/unexposed) for sensitive strains over (exposed/unexposed) for resistant strains. Differentially expressed transcripts are listed in Tables E1, E2, and E3.

