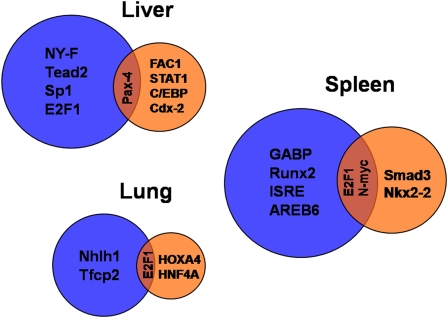
Figure 5.
Venn diagrams depicting transcription factor binding sites (TFBS) that are significantly (P < 0.005) overrepresented in the promoters of transcripts (from Figure 2B) that differentiate sensitive compared with Mut TLR4–resistant (blue circles) or sensitive compared with WT TLR4–resistant (orange circles) strains in the liver, lung, and spleen tissue. TRANSFAC accession numbers and P values for each TFBS are given in Table E4.

