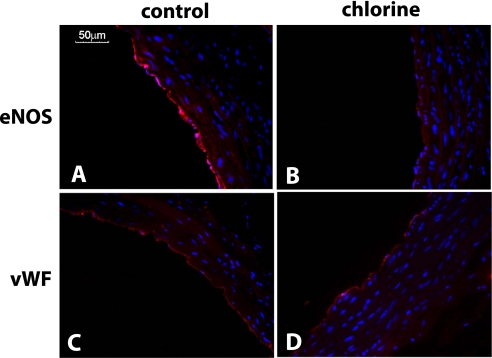
Figure 4.
Cl2 decreases eNOS protein expression. Representative immunofluoresence images for eNOS (A and B) or von Willebrand factor (vWF) (C and D) staining from aorta collected 24 hours after exposure to air (A and C) or Cl2 (400 ppm, 30 min) (B and D). Red = eNOS or vWF as indicated; blue = Hoechst staining for nuclei.

