Figure 6.
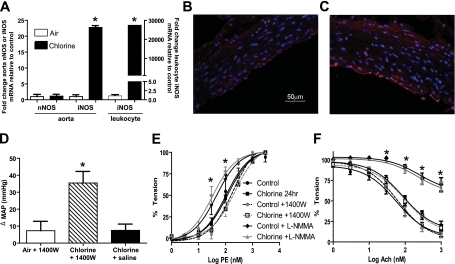
Role of systemic inducible nitric oxide synthase (iNOS) induction in post-Cl2–induced changes in MAP. (A) Rats were exposed to air or Cl2 (400 ppm, 30 min), and 24 hours thereafter neuronal nitric oxide synthase (nNOS) or iNOS mRNA expression from aorta or circulating leukocytes was determined. mRNA levels are expressed relative to air controls and after normalization to GAPDH. Right-hand y axis is for leukocyte mRNA levels. Data are mean ± SEM (n = 2–3). *P < 0.001 by t test relative to respective air control. (B and C) Representative immunofluoresence images of iNOS (red) staining in aorta from control or 24 hours after Cl2 exposure, respectively. (D) Rats were exposed to air or Cl2 (400 ppm, 30 min). MAP was measured 24 hours thereafter, and saline or 1400W (10 mg/kg) was added by intraperitoneal injection. After a further 18 to 24 hours, MAP was measured. Data show changes in MAP (post 1400W – pre 1400W administration) and are mean ± SEM (n = 2–4). *P < 0.05 relative to air + 1400W or chlorine + saline by one-way ANOVA with Tukey post-test. (E and F) Effects of 1400W (10 μM) or L-NMMA (100 μM) on PE-induced vasoconstriction or Ach-induced vasodilation of aorta isolated from control of Cl2–exposed rats, respectively. Data show mean ± SEM (n = 3–5). *P < 0.05 for control versus control + L-NMMA or Cl2 versus Cl2 + L-NMMA by two-way ANOVA with Bonferroni post-test.

