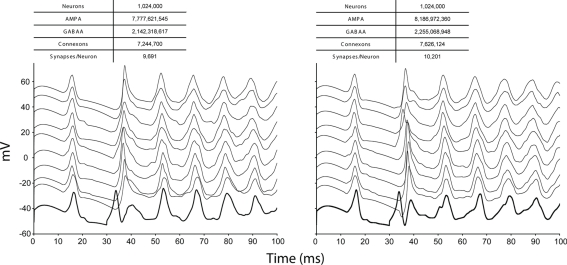
Figure 12.
Physiology of a very large tissue at different synapse densities. Recordings from 10 instances of the same basket cell morphology as in Figure 11 in a very large simulated tissue (inset table). Recordings were made from the somata. Again, we plot the first only at the correct scale of the recorded voltage, and each subsequent trace offset by 10 mV to allow inspection and comparison. A current of 500 pA was injected into the first somata at time 30 ms, and remained on for the duration of the simulation. Synapse densities were increased by 510 average synapses/neuron from the left to right panels.

