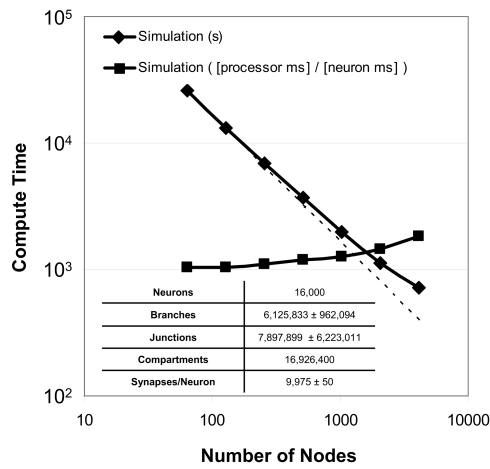
Figure 9.
Strong scaling. Plot of simulation times (100 ms of physiology) vs. number of computational nodes (4 cores/node) on Blue Gene/P for a constant number of neurons (inset table). Optimal strong scaling (dotted line) is shown for comparison. Scaling numbers are normalized and plotted a second time, and both plots show strong scaling to 4,096 nodes (16,384 cores) of Blue Gene/P.

