Figure 1.
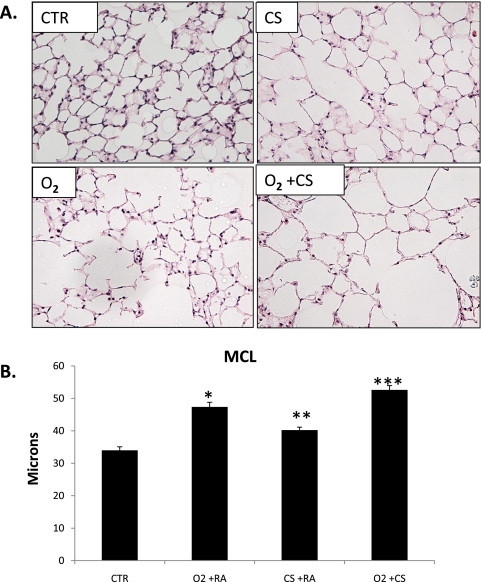
(A) Representative lung sections from control (Ctr), O2, cigarette smoke (CS), and O2+CS exposed mice. (B) Mean chord length measurements of Ctr, O2, CS, and O2+CS mice. O2 was significantly larger than CS and Ctr (*P < 0.002). CS was significantly larger than Ctr (**P < 0.05). O2+CS was significantly larger than all other groups (***P < 0.02) by one-way ANOVA. Error bars represent SEM (n = 3–8 per group).

