Figure 1.
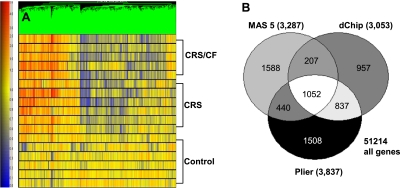
Gene tree derived from PLIER algorithm analyses of 3,837 differentially expressed genes in sinus mucosa from control, chronic rhinosinusitis (CRS), and CRS/cystic fibrosis (CF) patients. (A) The color scale for the gene tree is shown at left. Red and blue represent positive and negative changes in expression, respectively, versus the control condition. Color intensity is proportional to the magnitude of differential expression. Each row represents a separate patient in one of the three cohorts. Each vertical line represents an individual gene. (B) Venn diagrams show the number of statistically significantly altered probe sets generated by the MAS 0.5, dCHIP, and PLIER algorithms in the CRS and/or CRS/CF sinus mucosal specimens. White denotes the common differentially expressed probe sets (1,052) in all three algorithms. P < 0.05.

