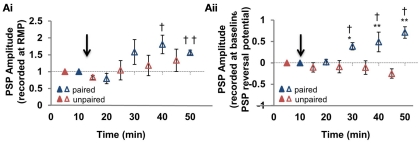
Figure 4.
Summary of disinhibition-mediated LTP pathway specificity. (Ai) Summary of the change in mixed PSP amplitude measured from the resting membrane potential, at the paired and unpaired pathways (n = 6). (Aii) Summary of the change in mixed PSP amplitude measured from the initial PSP reversal potential [for the same cells as in (Ai)]. Blue triangles denote paired pathways, red triangles denote unpaired pathways; filled triangles represent baseline recordings, open triangles represent recordings following plasticity induction. PSP–Vm curves were constructed at five time points, alternating between unpaired and paired pathways. Each of the five time points at the paired pathway were compared to the corresponding time point from the unpaired pathway. * Denotes statistical significance from unpaired pathway (p < 0.05). † Denotes statistical significance from baseline (p < 0.05). Paired activity denoted by arrow.

