
Figure 8.
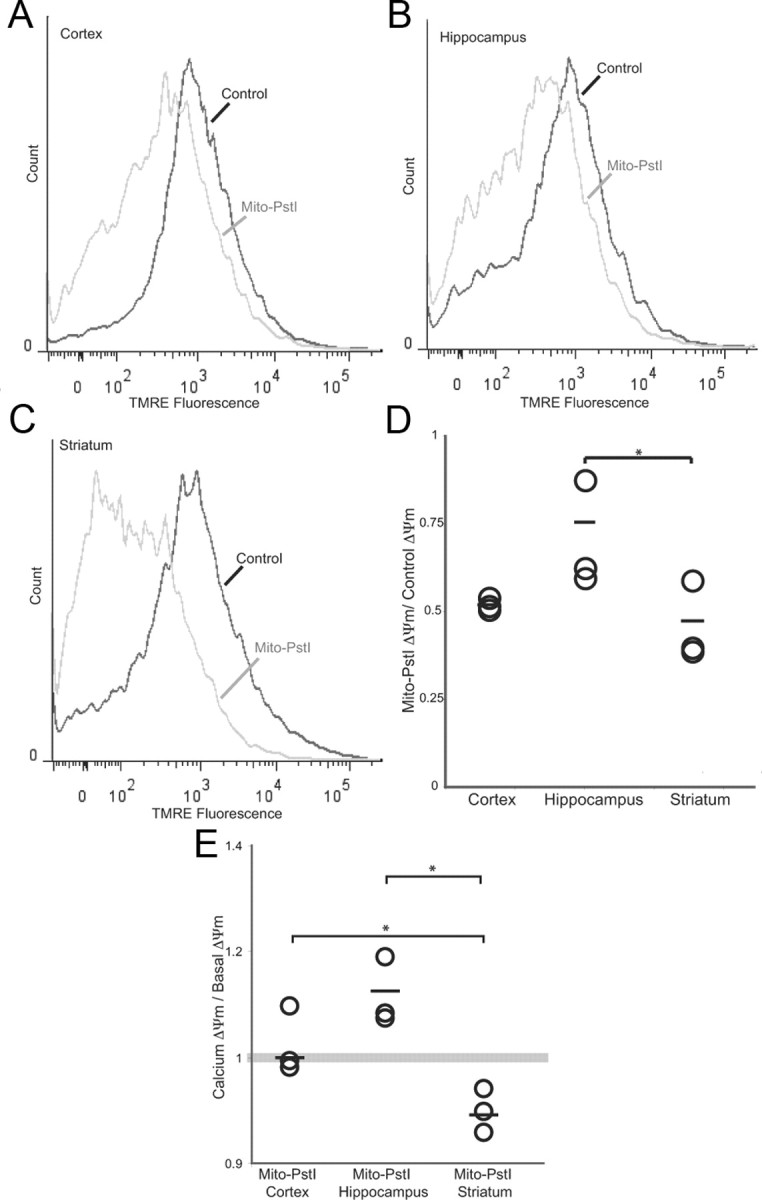
Basal ΔΨm is particularly decreased in the striatum of mito-PstI mice. Histograms depicting TMRE fluorescence of mitochondria from 2-month-old wild-type and Mito-PstI mice mouse at basal conditions. A, Cortex. B, Hippocampus. C, Striatum. D, Plotted changes in Mito-PstI ΔΨm/wild-type ΔΨm of cortex, hippocampus, and striatum. Circles represent individual animals (n = 3). Horizontal line represents mean. *p < 0.05. E, Plotted changes of the ratio of ΔΨm of mitochondria treated with low calcium to basal ΔΨm of the cortex, hippocampus, and striatum of Mito-PstI animals. Geometric fluorescence values were determined when gating for high ΔΨm mitochondria. Circles represent individual animals (n = 3). Horizontal line represents mean. *p < 0.05.