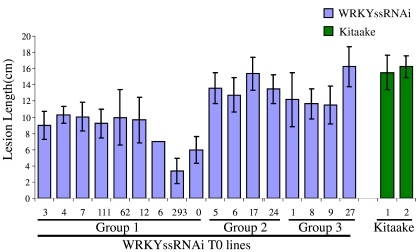
Fig. 3.
Xoo inoculation results of WRKYssRNAi T0 lines. The numbers listed below the bar represent individual transgenic plants. Group 1 includes plants super-overexpressing OsWRKY IIa genes. Group 2 includes plants super-silencing OsWRKY IIa genes. Group 3 includes plants with no change in OsWRKY IIa gene expression. Kitaake plants were used as controls. Leaves were inoculated when the plants were 5 weeks old. Lesion lengths were measured 14 days afterwards. Each bar represents the average and standard deviation of at least three leaves.

