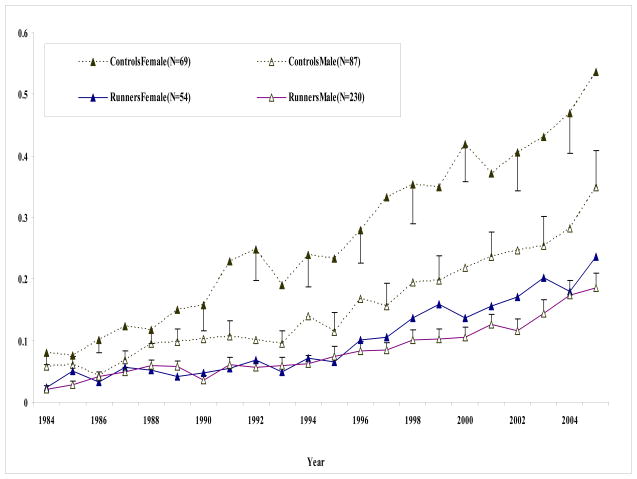
Figure 2.
Mean disability levels by year separated by gender. Mean and standard deviation for runners (solid lines) and controls (dashed lines) by year from 1984 through 2005. Male subjects are depicted with open triangles and females with solid triangles. Only subjects who completed the 21-years of follow-up are included.

